If you are a day trader, you know that it can be quite overwhelming to find the right indicator with all the options available on every trading platform. No one likes when the chart is overloaded with too many indicators full of confusing and conflicted signals. It can make trading ineffective and stressful. But if you use the right indicator, or combine a few, they may potentially assist you in selecting higher probability trades.
Some of the day traders use price action to analyze the market, but many of them use indicators. Technical indicators are especially popular because they add more filters and tend to be more objective, unlike the price action that can be subjective and lean on intuition (which is certainly not recommended for beginners).
In order to find the best indicators for your trading approach, try testing some of them singularly, and then attempt combining them. Many day traders end up sticking with a few favorites, but you can also switch them off depending on the market conditions that day. It is always best to keep it simple when it comes to indicators. Experts recommend using one from each category to avoid distractions and repetition.
What Is Technical Analysis?
If your goal is to understand what technical indicators are, the first thing to learn about is Technical Analyses. Technical Analysis is very different from financial and fundamental analyses because it doesn’t care about supply, demand, or price data. It just cares about the market’s moves. Technical analysis is tightly connected with technical indicators, which leads us to the next question:
What Are Technical Indicators?
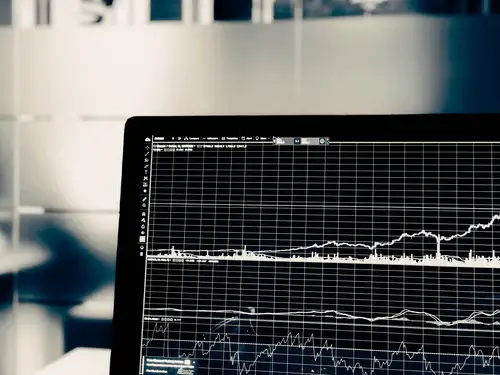
Technical indicators are visual representations of input data placed on a stock chart. They measure all sorts of data and help a trader forecast future price action. There are four main types (Trend Following, Oscillators, Volatility, and Support/Resistance), but there is a variety of combined options. Experts at NetPicks.com believe that, when combined creatively, they can form a unique tool useful for all day traders, including beginners. Types of technical indicators are usually grouped based on their function. Whether you want to predict the average price of a currency or get a clear picture of resistance and support levels – technical indicators cover all of it.
They are especially useful for day traders who trade on fast timeframes (sometimes under an hour) and they need to interpret price behavior very quickly. Sometimes there is no way to make the right decision with just fundamental data. If you are a day trader and you are wondering which indicators to pick from thousands, let’s look at some of them that are proven most effective.
1. Volume
Volume is considered to be a day trader’s best friend. It is the one that is most used and it’s familiar to beginner traders and investors. It has its own study in a technical analysis called Volume Analysis.
Volume can refer to contracts, lots, or shares, but it basically shows the number of monetary contracts traded over a time period. It is one of the most popular indicators and you can see it plotted in colored columns. Green indicates up volume and red indicates down volume. It’s not based on price, but on interest.
2.Volume Weighted Average Price (VWAP)
The VWAP is a technical indicator that averages the closing prices during a specific time period while emphasizing periods with higher volume. Since it’s based on previous data, it’s considered to be a lagging indicator.
3. Senkou Span B
This indicator is a part of the Ichimoku Kinko Hyo trading system and it’s a moving average, but still different than a simple moving average and exponential moving average. It was developed by Japanese technical analyses that focus on the concept of equilibrium. It is challenging but very useful.
4. Put It All Together
For the best results, you should put all three indicators together to create a trading strategy.
The Volume indicator filters the stocks in play, so you can know that many traders are watching. Make sure Volume is higher than 50%.
The VWAP indicator is a kind of a trigger, so you should go short when the price is below the VWAP, and go long when the price is above.
Senkou Span B’s job is to filter the trade direction. You should take short trades if the price is below Senkou Span B, and long trades if the price is above it.
Now you are well-informed and ready to have the best possible strategy for day trading. When you have a clever plan it can be the most fun and exciting experience that can change your lifestyle completely and help you make a lot of money in no more than 20 minutes. Day trading isn’t for everyone, but if you are interested you should give it a try by investing a small amount of money. Follow the tips above, be perceptive and smart, and use the indicators that have been proven effective and helpful.